Week 8: Big Data to Help

Instructions
In this week’s meeting, we look at some examples of how big data can be used to help with policy design and implementation. To prepare for this meeting, be sure to check out The Opportunity Atlas.
Required readings
- Esty, D. and R. Rushing. “The Promise of Data-Driven Policymaking”. In: Issues in Science and Technology 23.4 (2007), pp. 67-72. URL: https://www.jstor.org/stable/43314516.
- Jean, N., M. Burke, M. Xie, et al. “Combining Satellite Imagery and Machine Learning To Predict Poverty”. In: Science 353.6301 (2016), pp. 790-794. DOI: 10.1126/science.aaf7894.
- Chetty, R., J. N. Friedman, N. Hendren, et al. The Opportunity Atlas: Mapping the Childhood Roots Of Social Mobility. Working Paper 25147. National Bureau of Economic Research, 2018. DOI: 10.3386/w25147.
Further reading
- Proville, J., D. Zavala-Araiza, and G. Wagner. “Night-Time Lights: A Global, Long Term Look at Links to Socio-economic Trends”. In: PloS one 12.3 (2017), p. e0174610. DOI: 10.1371/journal.pone.0174610.
- Donaldson, D. and A. Storeygard. “The View From Above: Applications of Satellite Data in Economics”. In: Journal of Economic Perspectives 30.4 (2016), pp. 171-98. DOI: 10.1257/jep.30.4.171.
- Chetty, R., N. Hendren, P. Kline, et al. “Where Is the Land of Opportunity? The Geography Of Intergenerational Mobility in the United States”. In: The Quarterly Journal of Economics 129.4 (2014), pp. 1553-1623. DOI: 10.1093/qje/qju022.
Acknowledgments
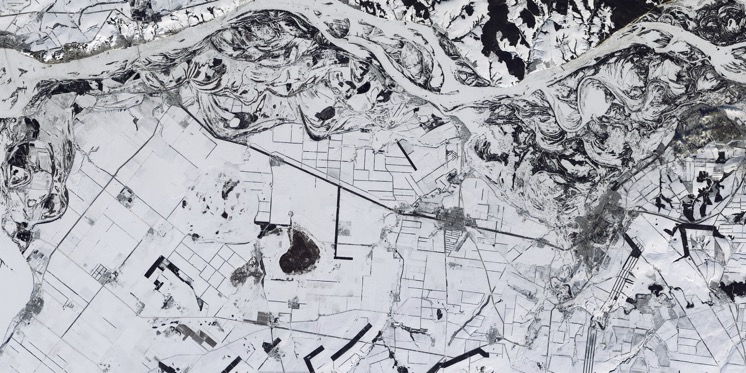
Photo credit: https://unsplash.com/photos/PuLsDCBbyBM.